www.GilesDarling.me.uk

Evolution of Residential Highway Design in South-East England - Modern Era

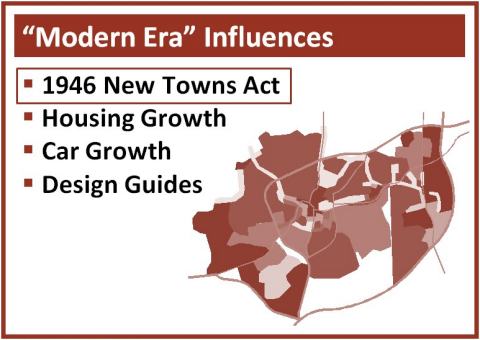
Widespread car use brings us to the modern era

Modern Era

New Towns Act

After the Second World War new house building took off again

However, inter-war housing had been criticised for lacking community spirit because the estates were seen as suburban sprawl to a remote urban centre

To rectify this, the 1946 New Towns Act proposed building completely new towns across the UK

These towns would have their own industrial, retail and entertainment centres and not act purely as dormitory towns to the neighbouring existing urban centres

This gave new opportunities for road layout designs, including residential roads

28 new towns were constructed. One of them is Crawley, in West Sussex


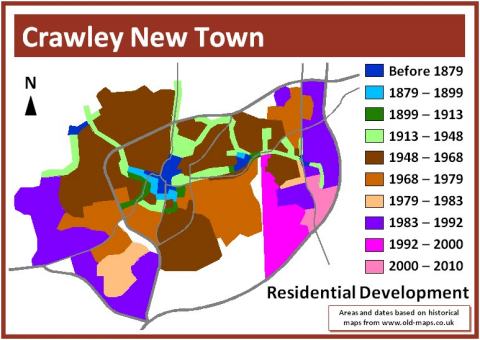
Within modern-day Crawley there were originally four villages or hamlets: (from west to east) Ifield, Crawley, Three Bridges and Pound Hill (the blue areas on the map)

The first half of the 20th Century saw ribbon development along the main traffic routes linking these villages (the green areas on the map)

Ribbon development is cheaper because you don’t need to build any new roads, but it’s spread out nature (this plan is approximately 7km from side to side) promotes car use instead of walking

The brown and orange areas on the map show the rapid expansion between 1948 and 1983

The purple and pink areas show house building in the last 20 to 30 years. Maidenbower (from the start of the presentation) is the pink and purple area in the South East corner of the map

Crawley New Town

Housing Growth

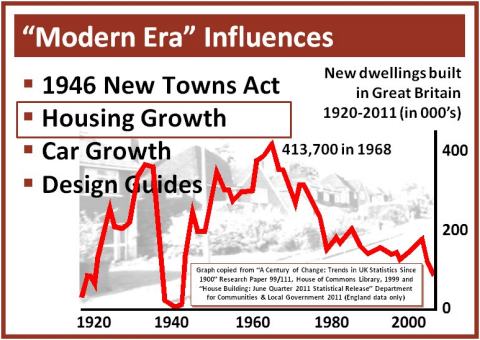
All governments between 1945 and 1971 actively encouraged house building with subsidies to developers and to councils to build more homes

This peaked with 413,700 new dwellings constructed in 1968, although many of these would have been in high rise flats rather than houses

After 1971 house building was left to market forces and it gradually declined


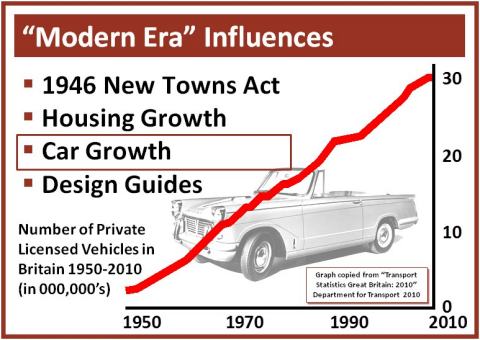
During this period the number of private licensed vehicles increased from 2.5 million in 1950 to just over 30 million in 2010

Increasing car ownership meant that housing estate road design had to take cars into account more significantly than before and this was reflected in the post-war road design guides

Car Growth

Design Guides

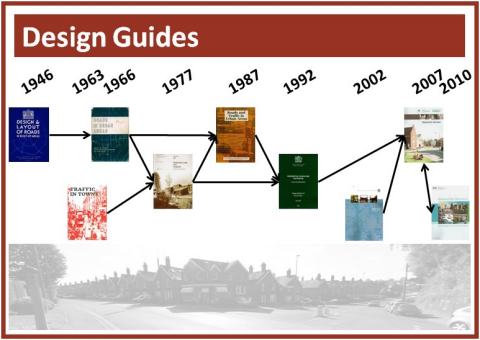
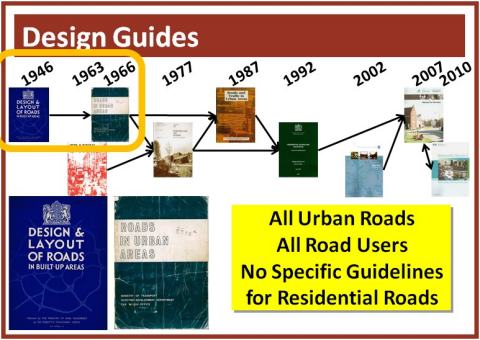
Here we have a flow chart showing a series of road design guides and documents from 1946 to 2010


The first two, "Design and Layout of Roads in Built-Up Areas" from 1946 and "Roads in Urban Areas” from 1966 covered all roads in urban areas

These guides considered the needs of all road users, including pedestrians and cyclists, but didn’t include specific guidelines for residential roads

Early Design Guides

Influential Documents

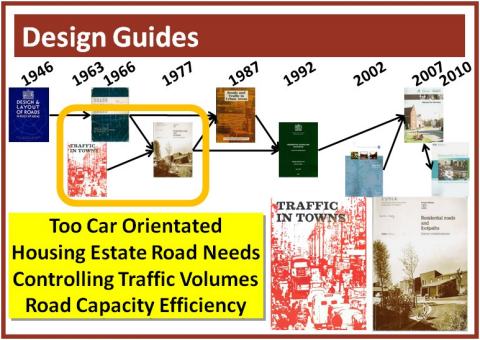
The 1970s saw concerns that roads in new housing estates were too car orientated and didn’t take into account local residents’ needs

An influential document from 1963 called "Traffic in Towns (also known as the Buchanan Report) moved away from old ideas of providing new roads to cope with increased vehicle numbers, and instead looked at ways of controlling traffic volumes and using road capacity more efficiently

So in 1977 a new design guide called "Residential Roads and Footpaths Layout Considerations" (also known as Design Bulletin 32 or DB32) covered housing estate road design and incorporated ideas from Traffic in Towns


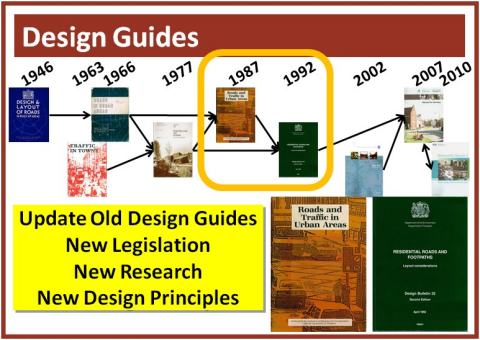
In 1987 "Roads and Traffic in Urban Areas" replaced "Roads in Urban Areas", and the second edition of DB32 came out in 1992 as the old documents needed updating to reflect new legislation, new research and new design principles

Design Bulletin 32

Manual for Streets

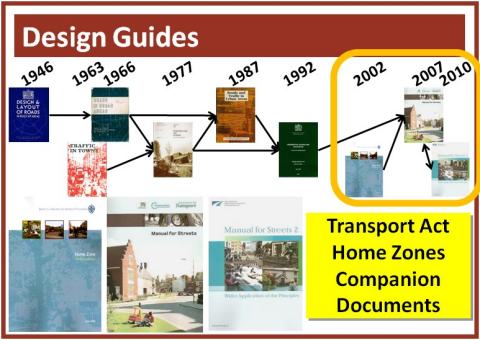
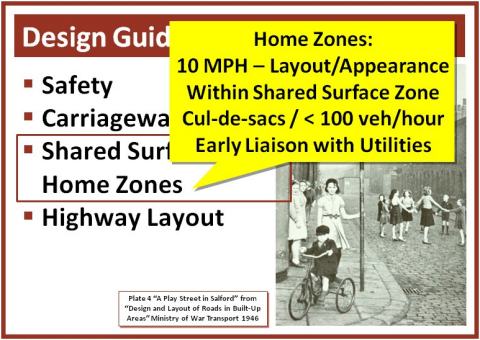
The Transport Act 2000 allowed local authorities to create Home Zones and the "Home Zone Design Guidelines" came out in 2002

In 2007 "Manual For Streets" replaced DB32 and included home zones

"Manual For Streets 2 – Wider Application of the Principles" was published in 2010 as a companion document to MfS1


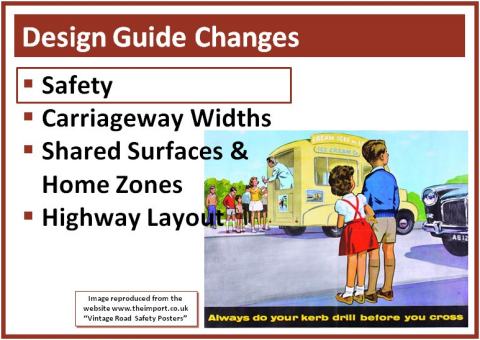
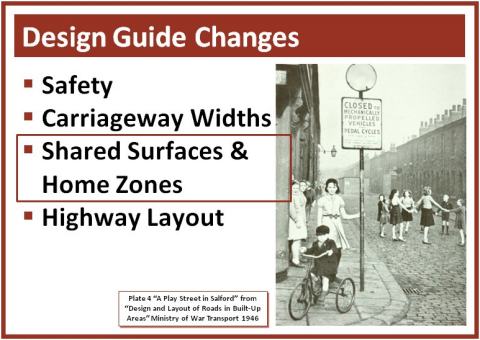
The primary concern in all the design guides is safety

However, methods to improve safety have changed significantly over the past 60 years

Safety

Car Dominated

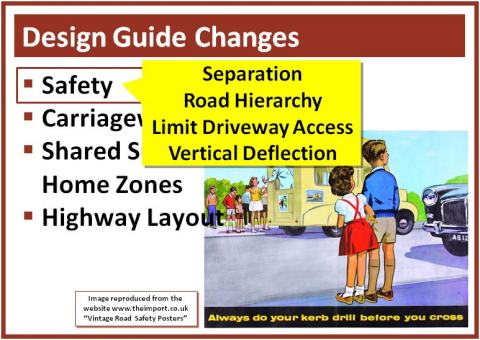
From the 1940s to the 1960s road design was car dominated and it was thought the safest way to protect pedestrians and cyclist from cars was to separate each type of road user

So, new roads would have a central carriageway, with cycle tracks and pedestrian footways all separated by wide verges. But this used space inefficiently

The Garden City idea of a road hierarchy was also expanded with more road types to keep heavy traffic away from residential areas

DB32 said that only roads serving less than 300 dwellings should have direct access to private driveways

This led to car dominated distributor roads, bordered by the backs of houses and their garden walls. These roads severed communities and deterred pedestrians and cyclists

The 1990s saw the use of vertical deflection (for example road humps, speed tables and raised junctions) to reduce vehicle speeds

However, these proved unpopular as they damaged vehicle suspension, road surfaces, buried utilities and also the foundations of adjacent buildings. They also caused discomfort and health problems for road users


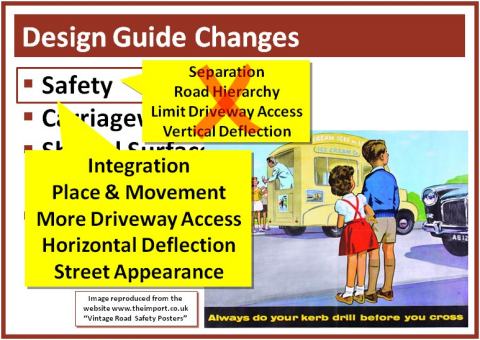
In the last 10 to 15 years the focus has moved away from car dominance and now instead the pedestrian’s needs are considered first. This is among a number of changes set out in Manual for Streets

Instead of separation we now have integration where the presence of pedestrians is emphasised so drivers travel more slowly and with more consideration

Road hierarchy has been replaced by a greater consideration to what’s around the road – for example schools, shops, recreation areas – and how this will interact with the road, thus balancing place and movement

MfS has replaced the 300 dwellings limit for private driveway access with a 10,000 vpd (vehicles per day) limit, even on 30 mph roads

So now, almost all housing estate roads can have direct access to private driveways, thus avoiding the car dominated roads of the past

Horizontal deflection, instead of vertical deflection, is now used to slow drivers down. This includes build-outs, chicanes, and even parking spaces

The street appearance also now plays a bigger role in slowing down drivers

Changing road surface material, more trees and bushes, and more street furniture like benches or play equipment all create an environment where the driver no longer feels dominant

Pedestrians' Needs

Carriageway Widths

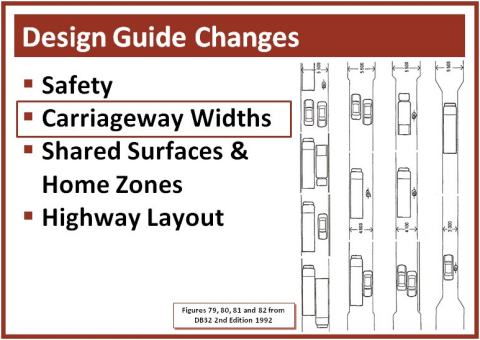
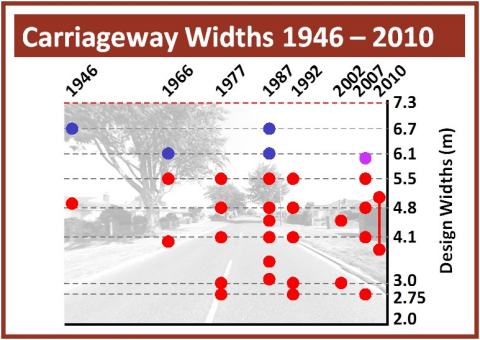
It’s interesting to see how carriageway widths are treated in the design guides

This diagram from DB32 shows different carriageway widths for different expected vehicle types and variants of this diagram are in many subsequent design guides


The line across the top is the Victorian 7.3m (24 feet) wide Bye-Law Street. The blue circles represent all purpose roads, and the red circles represent residential roads

The 1946 guidance included typical and minimum widths. In the 1966 guidance you start to see road type classifications: local distributors, primary access roads, and secondary access roads

DB32 in 1977 and 1992 detailed a range of residential carriageway widths that would continue through to MfS. The 1987 guidance included lane widths for local distributors, and an additional width for short cul-de-sacs

The 2002 home zone guidance defined clear width for vehicle routes rather than overall carriageway widths

MfS in 2007 also included a 6.0m carriageway width for bus routes, and advised that the widths are typical examples and "not necessarily recommendations"

MfS2 in 2010 moved away from specific widths and instead proposed a range of lane widths, providing extra space for cycle lanes to encourage cycle usage

MfS2 also confronted previous thinking that narrower roads automatically mean slower vehicle speeds, and instead we should use the overall layout to control vehicle speeds, and not rely so much on carriageway width

These widths have remained roughly constant over the past 50 years. But what about car widths?

Carriageway Widths 1946 - 2010

Typical Car Widths 1939 - 2011

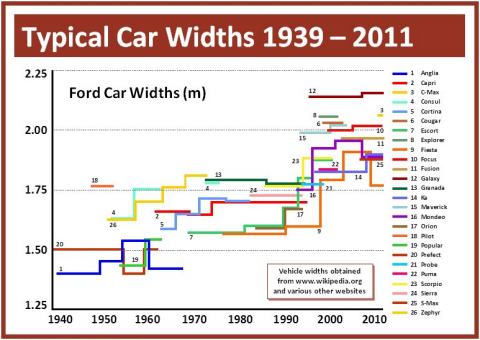
This graph shows widths for various Ford cars sold in the UK since 1939. I’ve chosen Ford because their cars have been popular for years. So changes in their design should reflect changes in the overall market

Based on this graph it appears that in the 1940s and 50s cars were on average about 1.4m wide. This increased to roughly 1.7m wide in the the 1960s to the 80s. In the past 15 years car widths have increased to around 1.9m

Reasons for these changes could include the switch from wing mirrors to door mirrors, bulkier side-impact safety measures in car doors, or the growing popularity of wider and higher SUVs, MPVs and 4x4s as recent legislation has required the use of child booster seats for all children, thus favouring the extra interior space of SUVs, MPVs and 4X4s

Will cars continue getting wider in the future, and do we therefore need to consider increasing carriageway design widths? Or alternatively, will demands for greater fuel economy and other environmental considerations actually result in smaller and narrower cars in the future?


The ideas behind Shared Surfaces and Home Zones are not completely new

This image shows a photograph of a "Play Street" in Salford from the 1946 design guide

The wording on the sign says "Closed to mechanically propelled vehicles and pedal cycles from sunrise to sunset except vehicles going to and from premises on the street"

The main difference between this play street and present day shared surfaces is that the street in the photograph has no special treatment except for the road sign

Shared Surfaces

Cul-de-Sacs

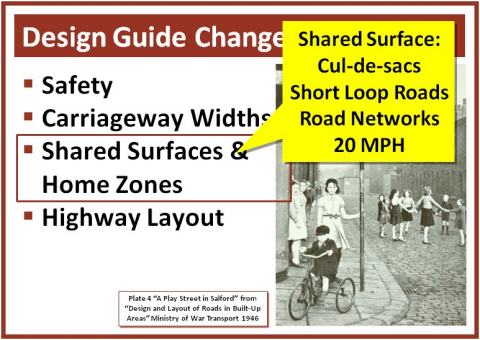
Shared surfaces are mentioned in DB32 and subsequent design guides. They are best used in cul-de-sacs or short loop roads, and can be applied to small road networks

Footways and the carriageway are at the same level to emphasise that drivers must share the surface with pedestrians and cyclists

Kerb lines are usually omitted, although they can be included, laid flush with the adjacent surface, to help those with impaired sight navigate their way

The speed limit in shared surfaces is usually 20 mph (32 km/h), and this should be enforced using road geometry, surfacing changes, street furniture, and planting

If drivers are able to travel too quickly, or if traffic volumes are too high, then pedestrians won’t feel safe enough to share the central part of the highway, and the road will revert to operate like a normal segregated highway

So not all roads will be suitable to become shared surfaces


Home zones are a more recent implementation of a shared surface

They have a lower 10 mph speed limit (16 km/h), again enforced through the road layout and appearance

They should be part of a wider shared surface zone, and not implemented in isolation and they’re best suited to cul-de-sacs where traffic flows will be less than 100 vehicles in the afternoon peak hour

Because shared surfaces and home zones have a less regular geometry and contain more planting of trees and bushes the routing of underground utilities can be more complicated. Therefore early liaison with utility companies is beneficial

Home Zones

Typical Highway Layouts

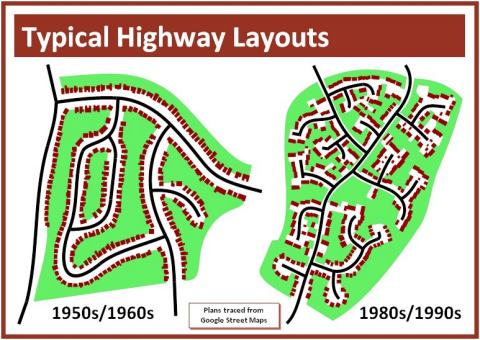
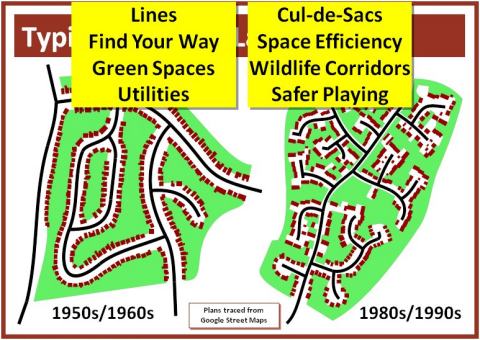
Finally it’s interesting to compare how highway layouts in housing estates have changed over the past 60 years

On the left is a trace from Google Street Maps of a housing estate in a Sussex town constructed in the 1950s and 60s

On the right is another housing estate from the same town constructed in the 1980s and 90s


The most obvious difference is that the housing on the left is in lines along each side of each road while on the right it is more grouped in cul-de-sacs

Many would say it’s easier to find your way around on the layout on the left as it has fewer junctions, but the layout on the right has more dwellings per hectare so it occupies the space more efficiently

The green spaces on the left are larger and more continuous partly because of the large back gardens. On the right the green spaces are smaller, but because they go up to the road edges it’s easier for wildlife to cross between the green spaces on the right

From a utilities point of view the layout on the left is preferable because straighter roads mean fewer manholes

However, the left hand layout is car dominated while on the right there are more quiet cul-de-sacs and therefore children should feel safer playing on the streets

Comparing Highway Layouts

Modern Highway Layouts

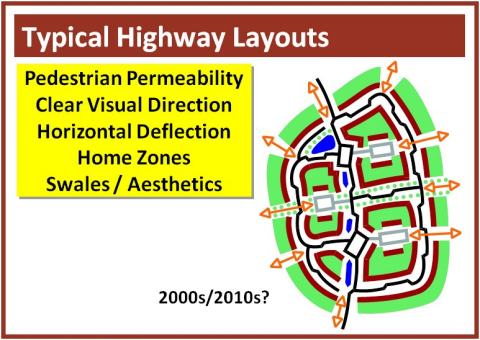
The latest layouts should consider pedestrian movements first. This site is very permeable and pedestrians can easily find their way round using direct routes, as the orange arrows show

The overall roads are relatively straight and provide clear visual direction for all users, while horizontal deflection of the carriageways is used to control vehicle speeds

There are dwellings to both sides of most roads, and they overlook footways, making pedestrians feel safer. Home zones (the grey rectangles) improve pedestrian safety in these areas

Swales and a balancing pond attenuate on-site drainage and provide local wildlife habitats

An avenue of trees across the middle of the site improves the overall aesthetic appearance


Even with all the changes over the past 60 years, there is skill scope for improvement. So what might happen in the Future?


Contact Me    Home Page This page was last updated on 17th December 2012