
|
Please find below a list of CAD lisp routines which I have written to automate common UK road design tasks when using CAD programs such as AutoCAD or CorelCAD
These free lisp routines were tested using CorelCAD 2013 which accepts AutoLisp. Therefore I assume these lisp routines will also work on AutoCAD, but as I don't have access to AutoCAD I cannot confirm this
You're welcome to download, use, copy, amend, and adapt these files, but at your own risk. I offer no support should these routines or commands not function as you expect. However, please feel free to leave constructive comments (see foot of webpage) and suggested improvements. I've checked these files for typing mistakes, but I suspect there's still some errors I haven't found yet
Beyond the table below, each command is explained in more detail (click on the command names to scroll down this webpage)
| Lisp files | Commands | Description |
|---|---|---|
| CHAINAGE.LSP (right click and select 'Save target as...' to download) Version 1.05 21-Jul-2015 (Version changes: 2D/3D point error resolved for polylines containing arcs. Text and polyline display issues resolved) Click here to scroll down to miscellaneous notes for this lisp file Click on the links below for an example CAD drawing on which you can try out the commands in this lisp file CHAINAGE.DWG CHAINAGE.PDF |
CHANGENT | Draws tangent marks at ends of polyline lines and arcs |
| CHEGMENT | Draws ST and radius values alongside polyline lines and arcs | |
| CHMARK | Draws chainage marks at selected points along a polyline | |
| CHMARKS | Draws chainage marks at regular chainages along a polyline | |
| CHXSECT | Draws section lines at selected points at right angles to polyline | |
| CHXSECTS | Draws section lines at regular chainages along a polyline | |
| CHOFFSET | Returns coordinates, chainage and offset of point relative to polyline | |
| CHOFFSETS | Returns coordinates, chainages and offsets for selection of points relative to polyline | |
| CHSETOUT | Returns a polyline's setting out information (chainages, coordinates, radii etc.) | |
| COLOURBY.LSP (right click and select 'Save target as...' to download) Version 1.05 13-Aug-2015 (Version changes: Text display issues resolved. Colours now applied correctly to each object type. COLOURBYSLOPE command removed) Click here to scroll down to miscellaneous notes for this lisp file Click on the links below for an example CAD drawing on which you can try out the commands in this lisp file COLOURBY.DWG COLOURBY.PDF |
COLOURBYX | Applies colours to points according to their x coordinates |
| COLOURBYY | Applies colours to points according to their y coordinates | |
| COLOURBYZ | Applies colours to points, lines, solids or lightweight polylines according to their z coordinates | |
| COLOURBYCHART | Draws charts of colours used in the COLOURBY commands above | |
| COLOURBYSET | Enables user to set new colour values for use in subsequent COLOURBY commands | |
| COLOURBYRESET | Resets colours to default values for subsequent COLOURBY commands | |
| PLINESWAPENDS.LSP (right click and select 'Save target as...' to download) Version 1.00 30-Jul-2013 |
PLINESWAPENDS | Swaps the direction in which a lightweight polyline is drawn |
| TOPOPROCESS.LSP (right click and select 'Save target as...' to download) Version 1.05 13-Aug-2015 (Version changes: Text and polyline display issues resolved. TPOPSOLID options increased to replace COLOURBYSLOPE) Click here to scroll down to miscellaneous notes for this lisp file Click on the links below for an example CAD drawing on which you can try out the commands in this lisp file TOPOPROCESS.DWG TOPOPROCESS.PDF |
TPOPTRIA | Draws 3D triangles based on a set of 3D points, boundaries and breaklines |
| TPOPSWAP | Swaps the shared edge between two adjacent 3D triangles | |
| TPOPGETTHIN | Returns the flatness ratio range for selected 3D triangles | |
| TPOPDELTHIN | Deletes flat or near-flat 3D triangles (e.g. around the boundary) | |
| TPOPSOLID | Draws 2D SOLIDs based on a set of 3D triangles and their colours | |
| TPOPCONT | Draws contour polylines based on a set of 3D triangles | |
| TPOPCONTLABEL | Draws text labels of contour z value next to selected contours | |
| TPOPSLOPEMAX | Draws maximum slope values and directions on selected 3D triangles | |
| TPOPSLOPEDIR | Draws slope value at a particular point/direction on selected 3D triangles | |
| TPOPLEVEL | Draws spot levels at locations picked within 3D triangles | |
| TPOPMULZ | Multiplies z coordinate values of 3D points by a user-defined value | |
| TPOPVOL | Returns the volume of 3D triangles from a zero base-line | |
| TPOPINTERS | Draws polyline(s) where two sets of 3D triangles intersect | |
| TPOPSETFUZZ | Sets the fuzz value used by other TOPOPROCESS commands to allow for rounding errors | |
| VCURV.LSP (right click and select 'Save target as...' to download) Version 1.03 10-Nov-2015 (Version changes: use 2D points when creating polylines) Click on the links below for an example CAD drawing showing the various options for drawing vertical curves using this lisp file VCURV.DWG VCURV.PDF |
VCURV | Draws vertical curves (also known as longitudinal curves or railway curves) |
 |
Miscellaneous notes about CHAINAGE.LSP All the commands in CHAINAGE.LSP require a lightweight polyline as input. The file contains a useful function called PARSE_POLYLINE (near the start of the file) that converts a polyline's entity data into a list of LINE and ARC elements, including start and end points, line or arc length, and arc centre-point, radius, and start and end angles To find an arc or circle's centre-point and radius from three points, the file uses equations derived in this PDF file (click here) To find a point's distance along a line and offset from that line, the file uses equations derived in this PDF file (click here) In CorelCAD lightweight polylines include the following data list set-up: (0 . LWPOLYLINE) ... (10 x y z) (42 b) (10 x y z) (42 b) (10 x y z) ... (42 0.0) where x y z = each vertex's coordinates, and b = bulge factor between vertices (= 0.0 for a straight line). There's always a zero bulge factor at the end of the list. In AutoCAD lightweight polylines points are 2D, which since Version 1.02, CHAINAGE.LSP can now process. If there are other differences with the list set-up, this might cause the commands in CHAINAGE.LSP to malfunction |
|
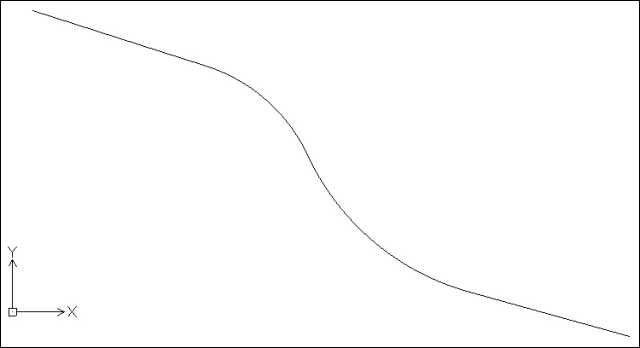
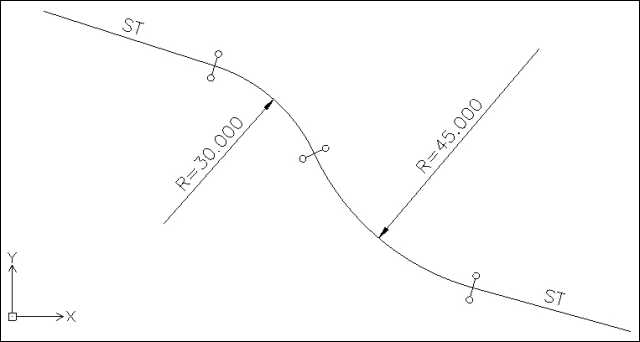
Draws tangent marks at ends of polyline lines and arcs, perpendicular to the lines or arcs. Where the lines or arcs do not join tangentially, the tangent marks are at the average perpendicular angle CHEGMENT Draws ST (for 'STRAIGHT') and radius values alongside polyline lines and arcs. There is the option to include radius lines from arc centres to arc midpoints (as shown) This image shows a polyline with tangent marks and ST and radius values added by these two commands Tangent marks, text, lines etc. are drawn using the current layer, colour, linetype, text style and size |
 |
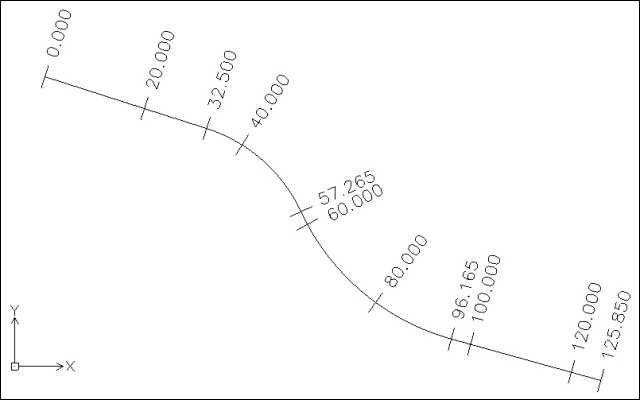 |
Draws chainage marks at selected points along a polyline. For example you could add chainage marks at tangent points, at junctions, or at the endpoints of polylines CHMARKS Draws chainage marks at regular chainages along a polyline This image shows a polyline with regular chainage marks (every 20 units) and chainage marks at tangent points and endpoints added by these commands There are three options for chainage mark numbering styles: n.nnn (as shown), n+nn and n+nn.nn where the + sign separates hundreds from tens and units Normally chainages start at 0 at the start of the polyline (as in this image), but the user can set a different start chainage in these commands (and the other commands in CHAINAGE.LSP) for the start of the polyline Chainage mark lines and text are drawn using the current layer, colour, linetype, text style and text size |
|
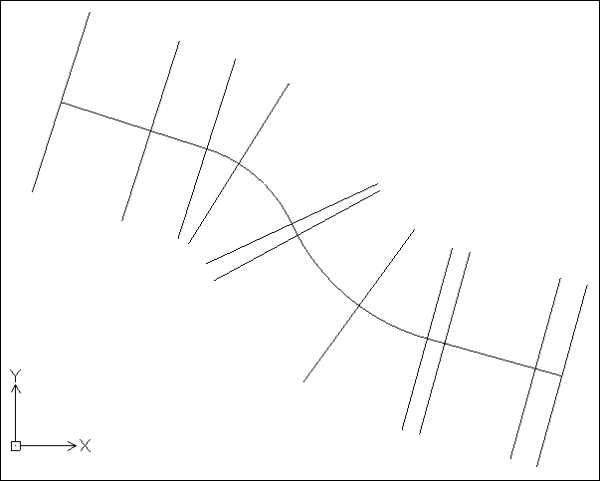
Draws section lines at selected points at right angles to a polyline. For example you could add section lines at tangent points, at junctions, or at the endpoints of polylines CHXSECTS Draws section lines at regular chainages along a polyline This image shows a polyline with regular section lines (every 20 units) and section lines at tangent points and endpoints added by these commands The section line length (40 units in this image) is set by the user Section lines are drawn using the current layer, colour and linetype |
 |
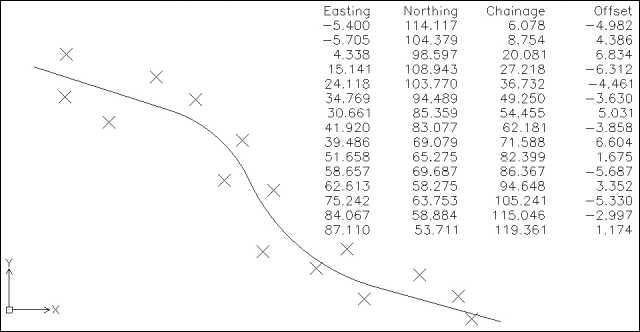 |
Returns coordinates, chainage and offset of individually selected coordinates relative to a polyline. The results can be displayed automatically as a group of MTEXT objects CHOFFSETS Returns coordinates, chainages and offsets for a selection of POINT objects relative to a polyline (the POINTS can be on or to either side of the polyline). The results can be displayed automatically as a group of MTEXT objects This image shows a group of POINT objects either side of a polyline, and the output from the CHOFFSETS command (text in top right corner of image) CHOFFSET is more suited when you need to select individual points, or coordinates on other objects (for example the end of a line, centre of a circle etc.) The MTEXT objects are drawn using the current layer, colour, text style and text size |
|
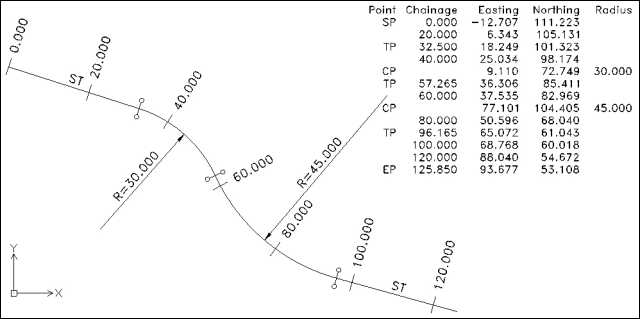
Returns a polyline's setting out information (chainages, coordinates, radii etc.) as a group of MTEXT objects SP = start point, TP = tangent point, CP = centre-point, EP = endpoint This image shows the MTEXT output (in the top-right corner) from this polyline. The image also shows regular chainage marks, tangent marks, and setting out ST and radius information, added using the other commands in CHAINAGE.LSP The MTEXT objects are drawn using the current layer, colour, text style and text size |
 |
 |
Miscellaneous notes about COLOURBY.LSP Through the use of colour, the commands in COLOURBY.LSP can help identify data trends more easily - for example high and low points from topographic survey contours, or steep and gradual slopes of a 3D design model The commands share seven base colours which the user can easily change. Note that changing the colours will not affect existing objects in a drawing that have already had colours applied to them Colours can be applied by value bands (dividing the minimum to maximum range equally per band), by quantity bands (dividing the total number of objects by the number of bands), by limits (above, between, below), or by intervals (for example major/minor contour levels) |
|
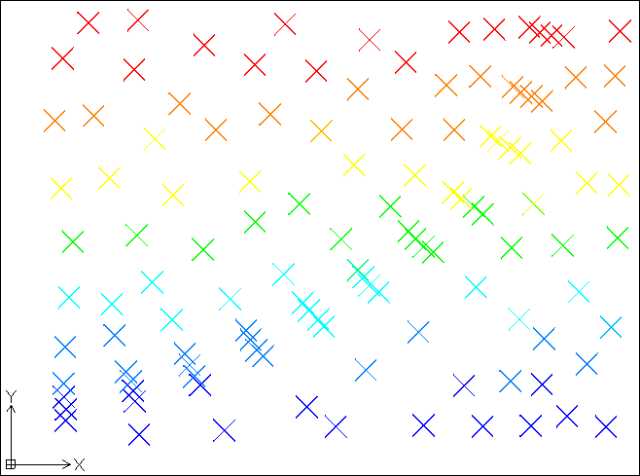
Applies colours to point objects according to their x coordinates This image shows POINTs coloured by 7 VALUE bands (i.e. the horizontal range has been divided equally into 7 bands, and POINTs are coloured according to which band they fall into) From 2 to 7 bands of colour can be defined by value Only the colour property of the selected point objects should change. All other properties (e.g. layer, linetype etc.) should remain unchanged |
 |
 |
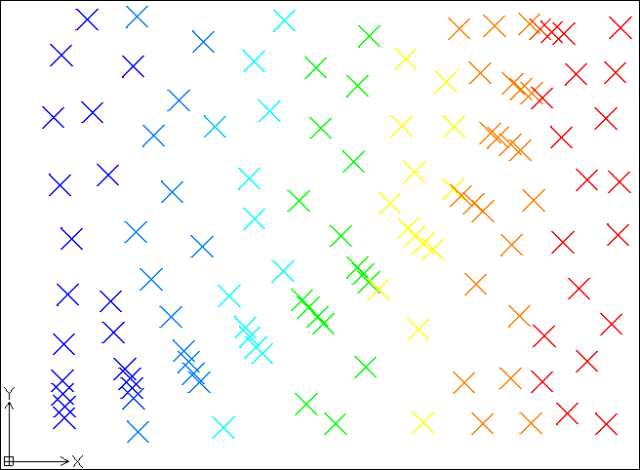
Applies colours to point objects according to their y coordinates This image shows POINTs coloured by 7 QUANTITY bands (i.e. the total number of points has been divided equally into 7 bands, so there should be the same number of points (+/- rounding errors) in each colour band) From 2 to 7 bands of colour can be defined by quantity Colouring by value and quantity will produce different results if the distribution of points is uneven - for example a triangular shaped group of points - not the case in this image where the points are distributed fairly evenly Only the colour property of the selected point objects should change. All other properties (e.g. layer, linetype etc.) should remain unchanged |
|
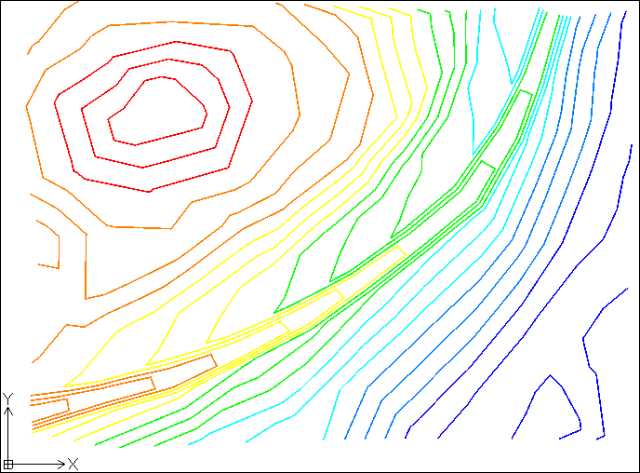
Applies colours to point, line, solid, or lightweight polyline objects according to their z coordinates This image shows lightweight POLYLINEs coloured by 7 value bands. These polylines are contours from a 3D topographical model (see TOPOPROCESS.LSP below), and colouring them makes it easier to identify the higher and lower parts of the survey Colouring polylines by INTERVAL can also be useful to identify major and minor contours. Colouring by interval also allows different colours above/below a datum (e.g. sea level) Only the colour property of the selected point, line or polyline objects should change. All other properties (e.g. layer, linetype etc.) should remain unchanged |
|
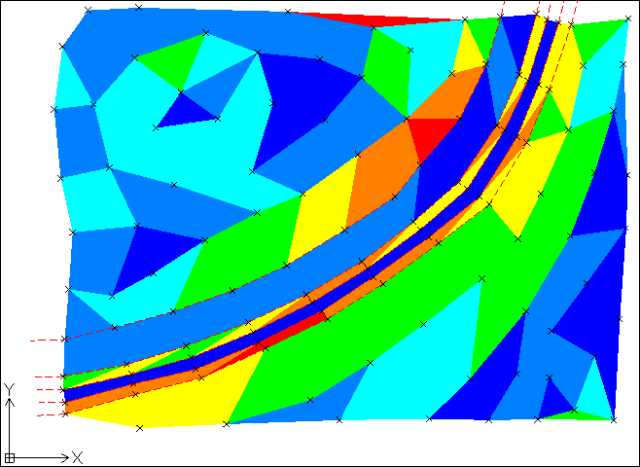 |
This image shows SOLIDs created using the TPOPSOLID command (see below) which draws solids over 3D polyline triangles Using COLOURBYZ to apply colours to these SOLIDs makes it easier to identify the steeper or higher (reds, oranges and yellows) and flatter or lower (greens and blues) parts of the survey. In this image the solids have been coloured by 7 quantity bands Colouring solids by LIMIT can also be useful to identify areas which are too steep (or high) or too flat (or low). Colouring by limit uses three colours: one for too steep (or high), one for too flat (or low), and one for in between the limits |
|
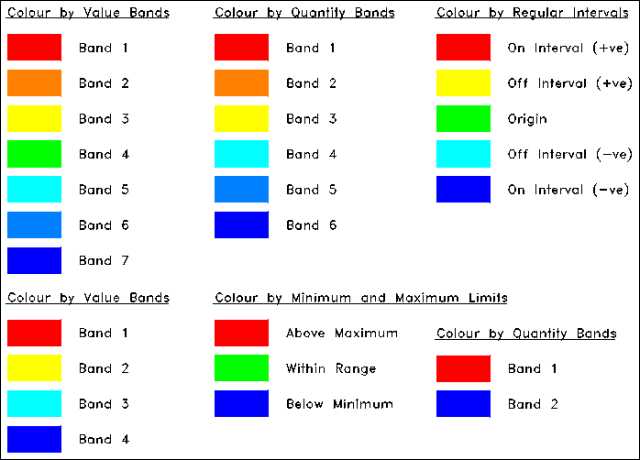
Draws charts of colours used in the other COLOURBY commands COLOURBYSET Enables the user to set new colour values for use in subsequent COLOURBY commands COLOURBYRESET Resets colours to default values for subsequent COLOURBY commands This image shows a range of colour charts, including by LIMIT (always three colours) and by INTERVAL (always five colours). When each chart is drawn it is accompanied by suggested text, which the user can update. When colouring by VALUE or QUANTITY, a list of band values is displayed in the command window, and this data is suitable for transfering into the text alongside colour charts To change colours, simply amend the colours in an existing colour chart (or a copy of a colour chart), and select the whole colour chart in the COLOURBYSET command. Changes will not be applied to any existing colour charts or coloured objects. You will need to re-run COLOURBYX etc. on the objects to apply the latest colours The vertical position of the colours determines which band each colour applies to. So, if you want to reverse the order of the colours, simply rotate the rectangles by 180 degrees, then use COLOURBYSET on the rotated rectangles to apply the reverse-order colours Note that because the charts share seven base colours, if you change a red rectangle in one of these charts to a different colour, and then redraw all these charts, they will all show the new colour in place of the previous red rectangle |
 |
|
Swaps the direction in which a lightweight polyline is drawn This can be useful for the switching the zero chainage from one end to the other of polylines used in the commands in CHAINAGE.LSP |
|
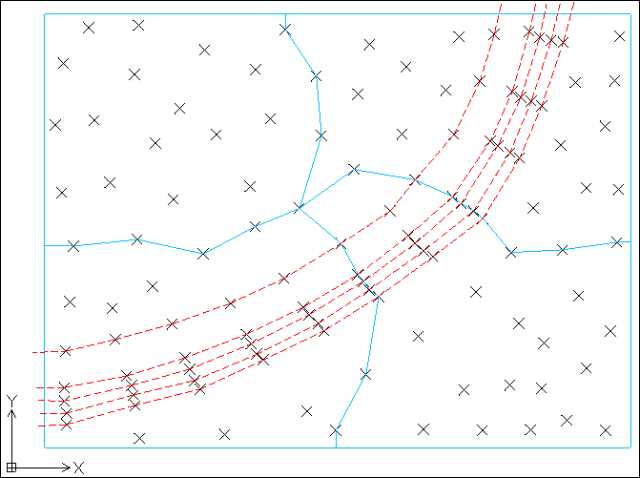
Miscellaneous notes about TOPOPROCESS.LSP This lisp file contains general purpose commands for processing small scale topographical surveys consisting of 3D point objects (the black crosses in this image), optional breaklines (dashed red lines in the image), and optional user-defined boundaries (blue in the image) It's best if breaklines and boundaries link point objects within the survey area, but outside the survey area they don't need to link points (as the boundaries show in this image). Boundaries need to be closed polylines Boundaries can also define islands within the survey area (not shown in this image) |
 |
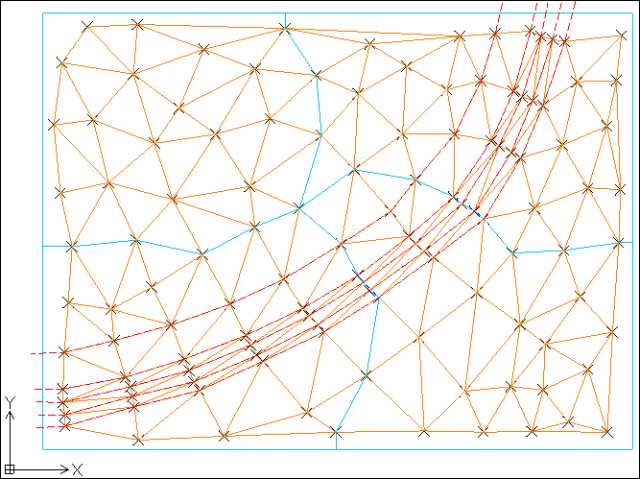 |
Draws 3D triangles based on a set of 3D points, boundaries and breaklines This command applies best-fit triangles (orange in this image) using the Delaunay triangulation algorithm, and then if any breaklines (the dashed red lines in the image) or boundaries (the blue lines in the image) are defined, the command swaps triangle so that no triangles cross the breaklines or boundaries This command can be used without any breaklines or boundaries being defined However, note that this command is not optimised for speed. Therefore selecting more than 50 points at one time can lead to processing times of many minutes (50 points required about 4 minutes to process on my computer). Therefore it is advisable to divide the points into smaller groups (as shown in the image) and process each group individually Delaunay Triangulation requires finding the circle that passes through three points. TPOPTRIA uses equations derived in this PDF file (click here) to do this TPOPTRIA and many of the other commands in TOPOPROCESS.LSP also need to check when lines cross. They use equations derived in this PDF file (click here) to do this, including when using a Ray Casting Algorithm to determine whether a point is within a polygon/boundary The 3D triangles (closed 3DPOLYs) are drawn using the current layer, colour and linetype |
|
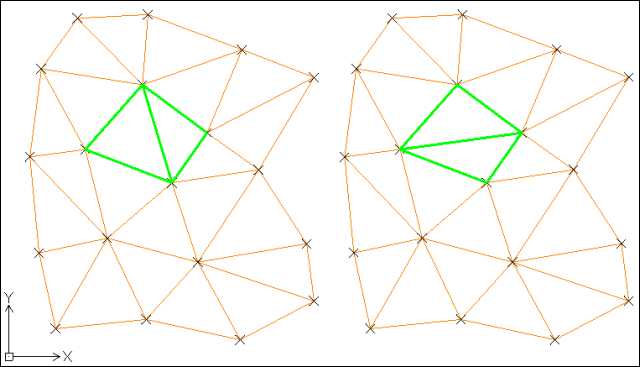
Swaps the shared edge between two adjacent 3D triangles Sometimes it may be necessary to swap the shared edge of two adjacent triangles (this image shows before/after swapping the shared edge of a pair of green triangles). This command enables the user to swap such triangles Note that it isn't possible to swap triangles if the outline after doesn't match the outline before swapping edges The newly swapped 3D triangles (closed 3DPOLYs) are drawn using the current layer, colour and linetype |
 |
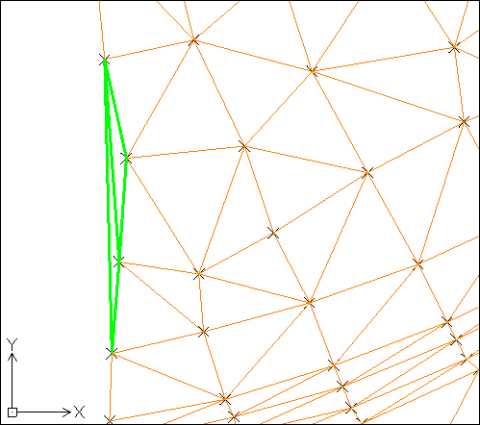 |
Returns the flatness ratio range for a group of selected 3D triangles TPOPDELTHIN Deletes flat or near-flat 3D triangles (e.g. around the edge of a group of 3D triangles) The ratio is the length of the longest side divided by the perpendicular distance to the opposite point. Flat (or thin) triangles can be created where three or more points are almost in line, commonly around the outside edge of a survey (the green triangles in this image) TPOPGETTHIN can help identify if there are any hidden flat triangles (at a large scale they can appear as lines, so can go unnoticed) if (for example) the maximum ratio returned is 50 or more. In some situations triangles with lower ratios may also be unwanted In TPOPDELTHIN there is the option to delete only flat triangles on the edge of a group of 3D triangles, as sometimes flat triangles are unavoidable (even if undesirable) within a survey |
|
Draws 2D SOLIDs based on a set of 3D triangles, the z coordinates of each triangle, and (optionally) their colours This command can be useful for quickly identifying where TPOPTRIA may have failed to add a triangle (i.e. created an unwanted island within the survey) (see TPOPSETFUZZ below) The z coordinate of each solid object can be either the average z coordinate of each 3D triangle, or the maximum slope of each triangle (in percentage terms - i.e. 2.5 for 2.5% or 1 in 40) The solid objects are drawn using the current layer and colour, unless the 3D triangles have specific colours and the user wishes to copy those colours (useful if you need to apply solid colour to a group of coloured 3D triangles) The solids can be coloured using the COLOURBYZ (see above) command. In this image the solids have been coloured by 7 quantity bands To find the slope value for each closed 3D polyline triangle, the command uses equations derived in this PDF file (click here) |
|
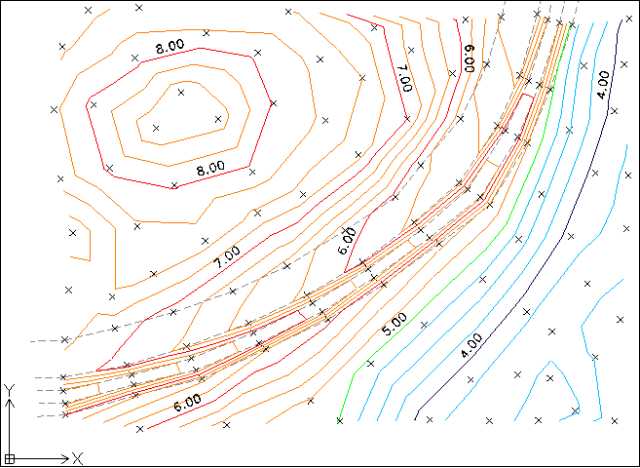 |
Draws contour polylines based on a set of 3D triangles TPOPCONTLABEL Draws text labels of contour z value next to selected contours at selected locations The polylines and text are drawn using the current layer, colour, linetype and text style The contours can be coloured using the COLOURBYZ (see above) command. In this image the contours are coloured by 1.0 unit intervals with a 5.0 unit datum (i.e. red/orange major/minor contours above the datum, green on the datum, and dark blue/light blue major/minor contours below the datum) |
|
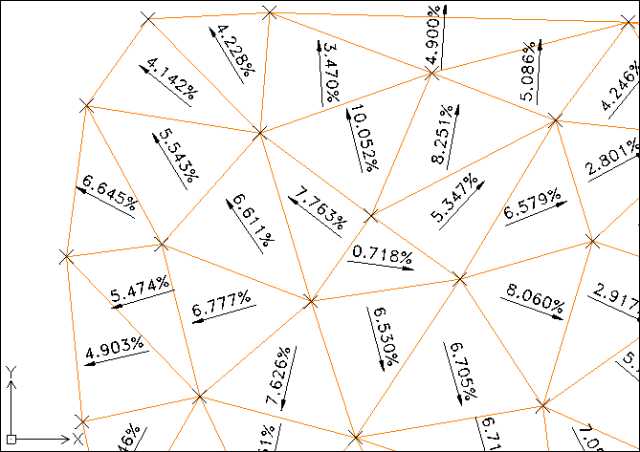
Draws maximum slope values and directions on selected 3D triangles TPOPSLOPEDIR Draws the slope value at a particular point and direction on selected 3D triangles Where a 3D triangle is flat (i.e. all three corners have the same z value/elevation) no direction arrow is drawn TPOPSLOPEDIR enables slopes, other than the maximum slope, to be shown in different directions The slope text and direction arrows are drawn using the current layer, colour, linetype and text style To find the slope/plane defined by three 3D points, the command uses equations derived in this PDF file (click here) |
 |
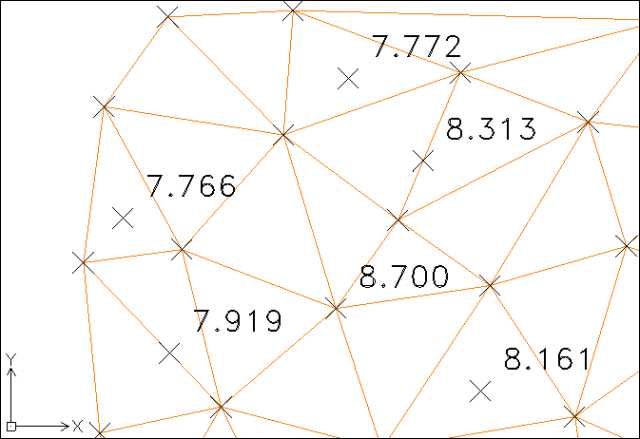 |
Draws spot levels at locations picked within 3D triangles TPOPMULZ Multiplies z coordinate values of 3D points by a user-defined value TPOPLEVEL draws a 3D point object at the selected location, and text nearby showing the level at the selected location. The point and text are drawn using the current layer, colour and text style If the user-defined value in TPOPMULZ is less than 1 then the z coordinate values will be reduced in magnitude |
|
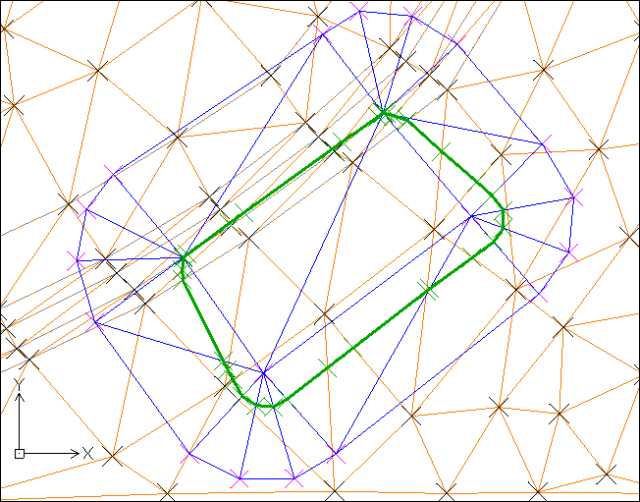
Returns the volume of 3D triangles from a zero base-line TPOPINTERS Draws polyline(s) where two sets of 3D triangles intersect TPOPVOL does not calculate separate cut and fill volumes. So if the 3D triangles straddle the z=0 plane then the resulting value will be cut subtracted from fill In order to calculate separate cut and fill volumes, use the TPOPINTERS command to identify the cut/fill boundary, then use TPOPTRIA to create new sets of 3D triangles upto this boundary, and finally use TPOPVOL twice to calculate volumes inside and then outside this boundary. For a z=0 plane create two large 3D triangles, with z=0 coordinates, enclosing the 3D triangles to be measured TPOPINTERS requires the two sets of 3D triangles to be on different layers. For meaningful results the extent of one set of triangles should be totally enclosed within the extent of the other set of triangles (in this image the blue set of 3D triangles is completely within the orange set of 3D triangles) TPOPINTERS draws polyline(s) along the intersection line and 3D points (both shown in green in this image) where the intersection line crosses 3D triangle edges (though not repeating existing 3D points). The polylines drawn can be closed or open depending on the 3D triangles The polyline and points drawn by TPOPINTERS are drawn using the current layer, colour and linetype To find the intersection of two slopes/planes defined by two 3D triangles, TPOPINTERS uses equations derived in this PDF file (click here) |
 |
|
Sets the fuzz value used by other TOPOPROCESS commands to allow for rounding errors Using a "fuzz" value enables commands in TOPOPROCESS.LSP to treat nearly equal values as equal (e.g. 0.000000000001 as 0.0). This takes into account rounding errors that occur following complex calculations The user can set the fuzz value to 0 (i.e. no fuzz) in which case it is more likely that TPOPTRIA (for example) will not successfully draw all the required 3D triangles and will leave unwanted islands. Or the user can set the fuzz value in a range from 1 (very small) to 9 (least small) The default value is 5, but the user may feel inclined to experiment with other values if TPOPTRIA and other commands do not behave as expected. Changing TPOPSETFUZZ only affects subsequent calls to commands. It does not affect any points, 3D triangles, solids, polylines or text already created |
|
Draws vertical curves (also known as longitudinal curves or railway curves) either for given start and end gradients or fitted to existing lines or 2D polyline line segments, using equations derived in this PDF file (click here), for single radius or K values or for a range of radius or K values TP (or tangent points) at each end of each curve, maximum or minimum level markers, and/or curve parameters can be shown with each curve. Curves are drawn as polylines or as blocks if additional information is shown for each curve The horizontal step size can be specified - this affects the smoothness of the curve drawn - and vertical exaggeration can be applied to curves to assist visualisation of the proposed vertical curve |
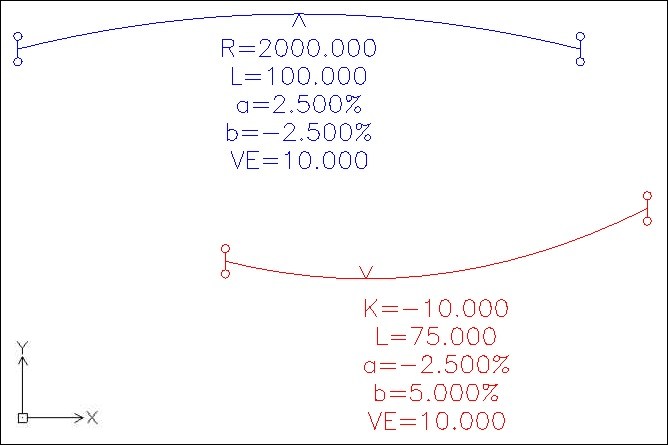 |
I hope to add further lisp routines and commands in the coming months. Please revisit this website later this year or early next year to see what's been added
| Contact Me Home Page | This page was last updated on 14th November 2015 |